BixBench Verified 50: Evaluating BIOS Biological Agents
We tested the BIOS AI scientist on BixBench-Verified-50, a new benchmark measuring how AI agents perform in real biological research scenarios.
AI agents are beginning to perform real biological analysis: inspecting datasets, running computational workflows, and producing valuable research outputs. As AI for science moves closer to practical use in labs, the question of how to evaluate biological agents properly becomes increasingly important.
To better understand how the BIOS AI scientist performs in biological research environments, we evaluated it on the BixBench-Verified-50, a new benchmark for biological agents.
What is the BixBench Verified 50?
BixBench, originally developed by Edison Scientific, evaluates whether an agent can analyze biological datasets and answer short research questions across several bioinformatics domains.
Recently, Biomni Labs revisited the benchmark and proposed a cleaned subset of tasks. From the original 250 questions, they curated 50, excluding questions that they determined to be too ambiguous, underspecified or based on incorrect ground truth.
The resulting BixBench Verified 50 provides a clearer dataset for evaluating biological agents.
BIOS Results: Global SOTA
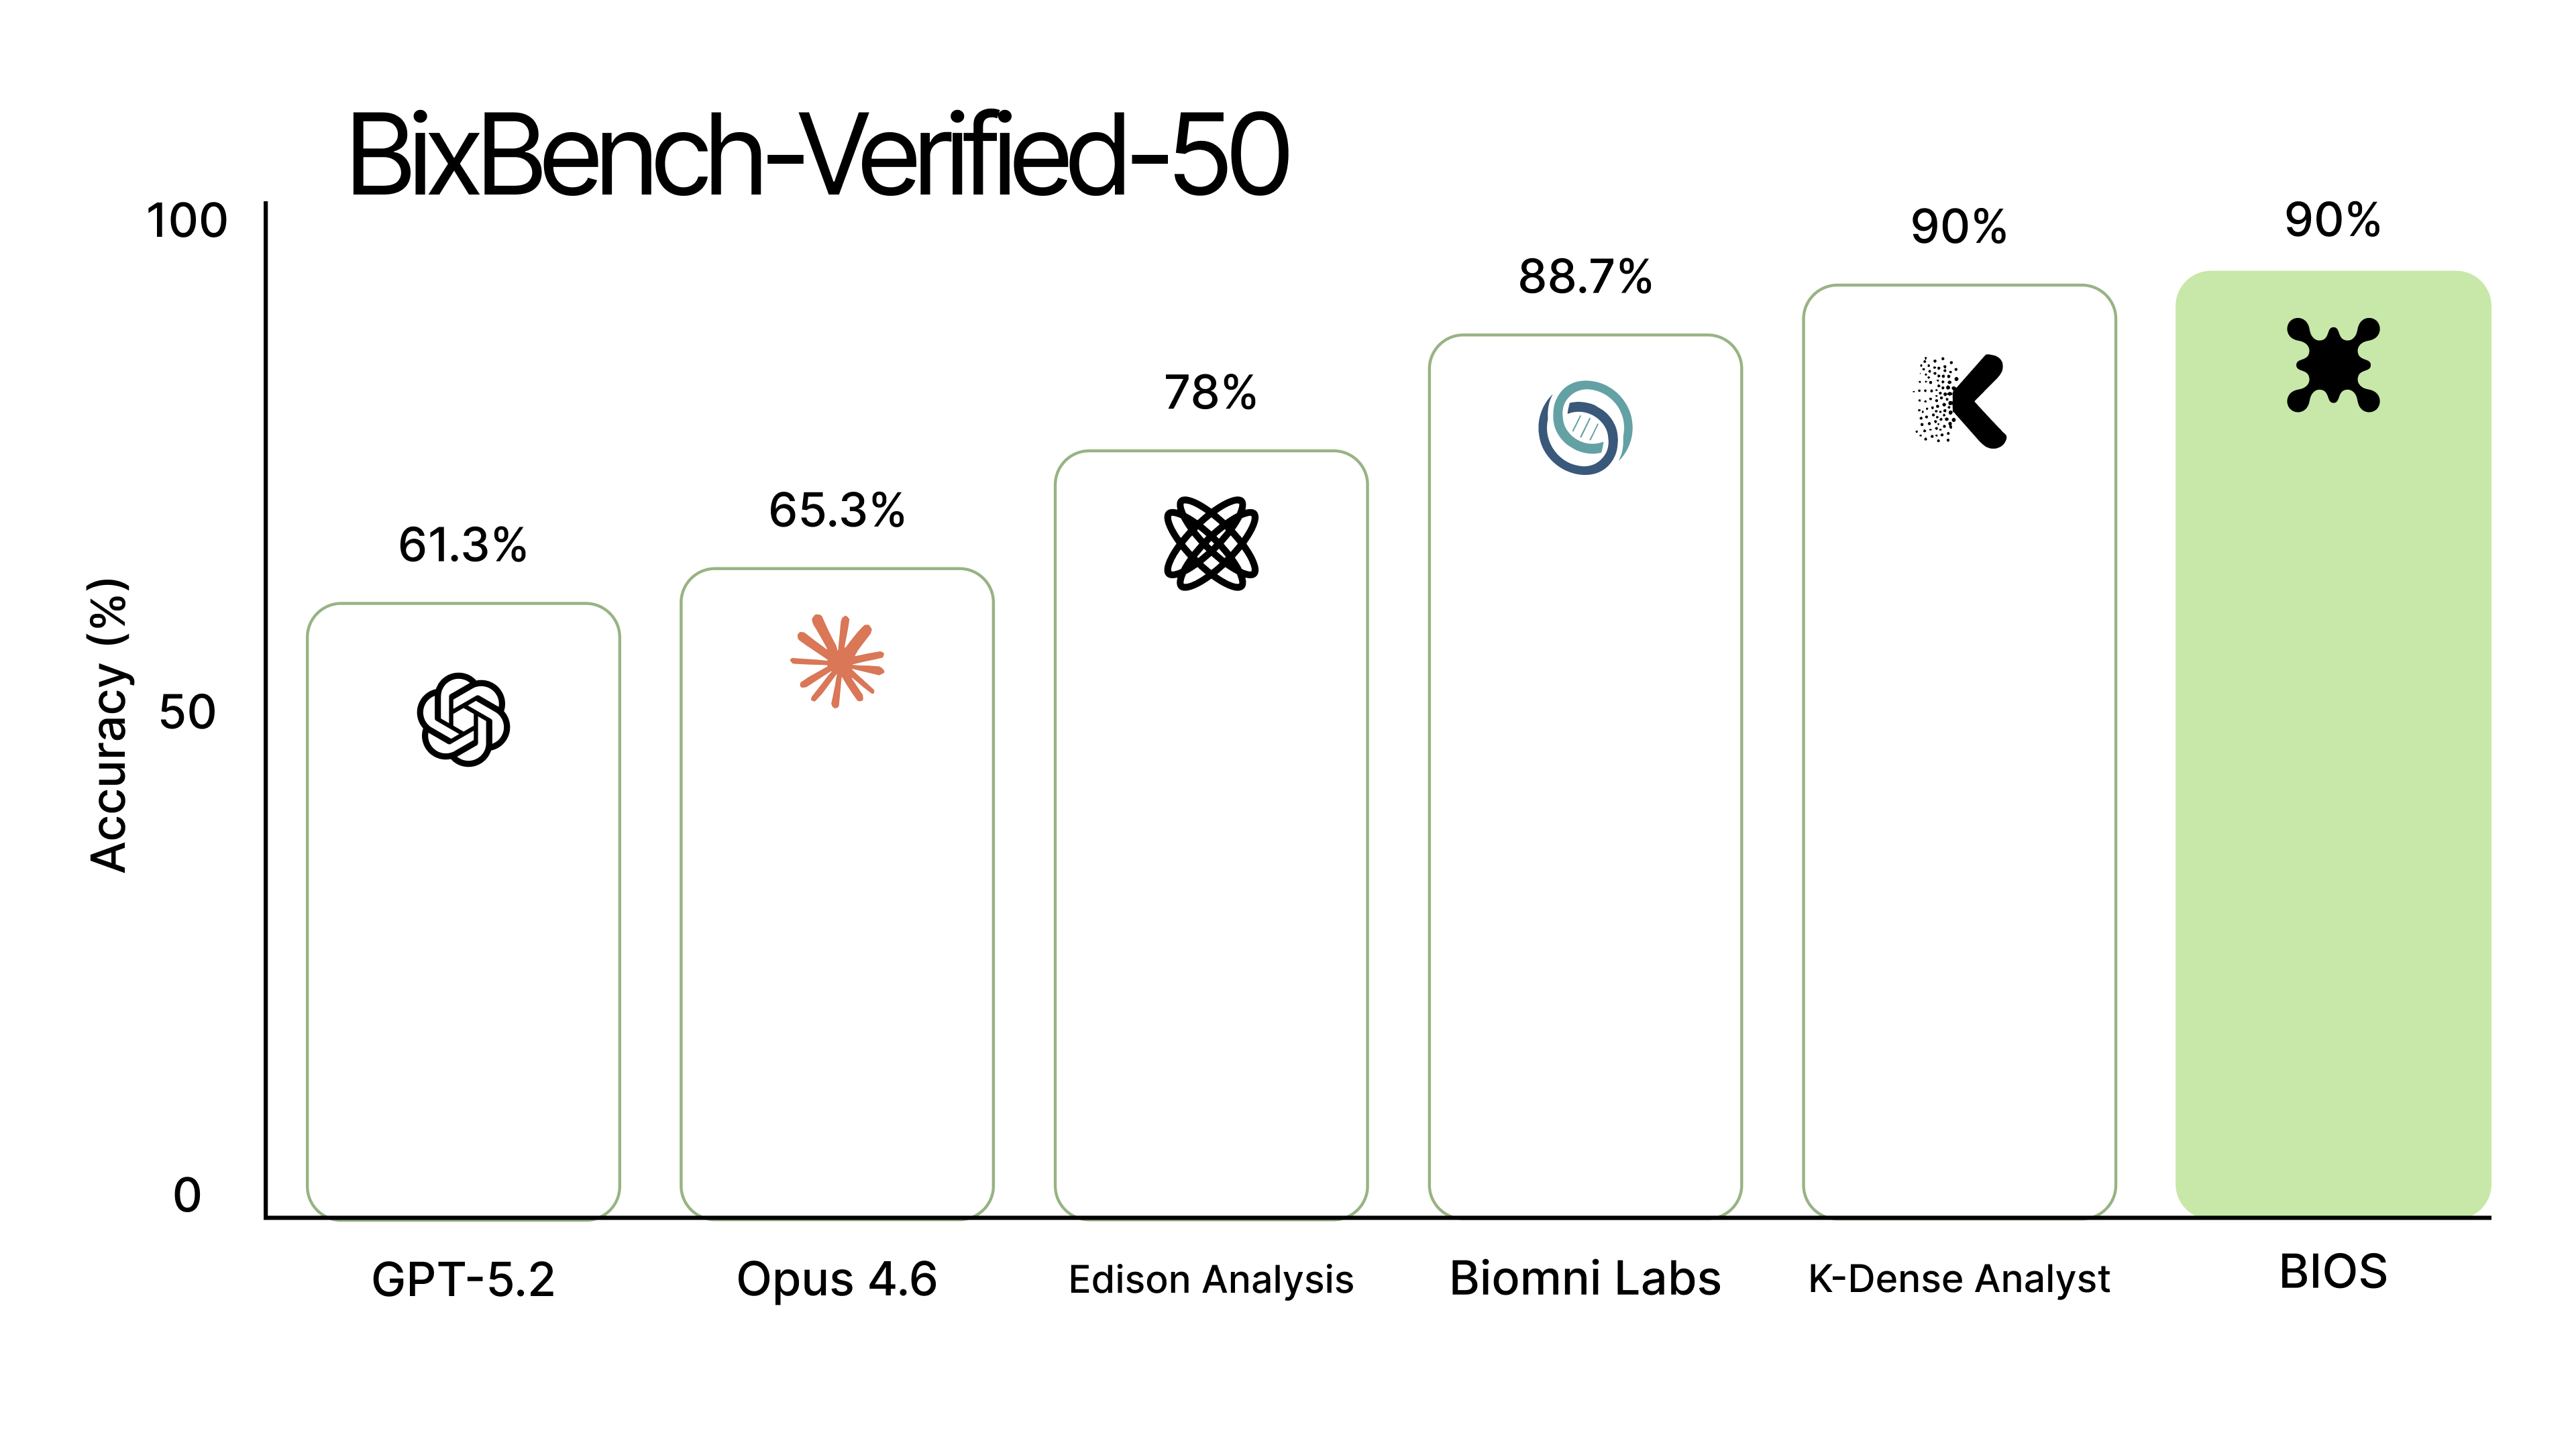
We evaluated BIOS on the BixBench-Verified-50 alongside domain-specific and general-purpose agents. BIOS and K-Dense achieved the highest accuracy across the benchmark at 90% accuracy, followed by Biomni Lab at 88.7%, Edison Analysis at 78.0%, Claude Code (Opus 4.6) at 65.3%, and OpenAI Agents SDK (GPT-5.2) at 61.3%.
-
Full results: https://bio-xyz.github.io/bio-benchmark/
-
You can verify the results yourself: https://github.com/bio-xyz/bio-benchmark

Additional Observations
Beyond the aggregate accuracy score, several patterns emerged when examining BIOS performance across repeated runs of the benchmark.
High consistency across the majority of tasks.
Across the benchmark, 38 of the 50 questions (76%) were answered perfectly across every repeat. In these cases the agent consistently reproduced the same analysis pipeline and final answer with no variability. This level of stability is encouraging for scientific workflows, where reproducibility of analysis is often as important as correctness.
MCQ grading acts as a reliable recovery mechanism.
For evaluation with multiple-choice answers, the MCQ format recovers many responses that would otherwise be marked incorrect by the direct grader. Across the benchmark we observe a 65.2% rescue rate, meaning the MCQ evaluation recovers nearly two thirds of answers initially graded as incorrect. Importantly, this mechanism introduces no false positives — ie., it never converts a correct answer into an incorrect one.
Several failures are purely grading artifacts.
In five questions, MCQ evaluation rescues 100 percentage points of failures. In these cases the model consistently produces the same numerical answer every run, but the direct grader marks it incorrect due to formatting or rounding differences relative to the benchmark ground truth.
For example, in bix-11, the agent consistently outputs: 35.34%, 0.0501 while the benchmark ground truth is: 35%, 0.05
The analysis is correct, but the strict grader rejects it because of a numeric formatting mismatch. These cases highlight how evaluation pipelines can misjudge agent performance when grading rules are overly rigid.
One task remains a complete failure. One question — bix-32-q2 — fails across every run and every grading mode. Unlike the cases above, this appears to be a genuine capability gap rather than a grading artifact.
Deep Dive: Bix-16
One of the most instructive failure cases is bix-16, which evaluates correlations between gene expression and gene essentiality across cancer cell lines.
The task asks the agent:
-
How many genes in the provided data show strong positive Spearman correlation between expression and essentiality across cell lines, with a correlation coefficient >= 0.6?
-
In the provided data, what gene symbol has the strongest negative Spearman correlation between its expression and essentiality?
-
Using a Spearman Rank correlation test and Benjamini-Hochberg multi-test correction, what percentage of genes show a statistically significant correlation between expression and essentiality, in either direction?
The BIOS agent consistently produces the following outputs:
- bix-16-q1: 0
- bix-16-q3: CCND1
- bix-16-q4: 21.80%
The benchmark ground truth, however, is bix-16-q1: 3, bix-16-q3: CDKN1A, and bix-16-q4: 20–25%. This means the third answer is correct, while the first two are consistently wrong across all repeats.
Interestingly, the failure is highly stable. Across all repeats, the agent always produces the same incorrect answers. Investigating the generated analysis revealed the following result table:
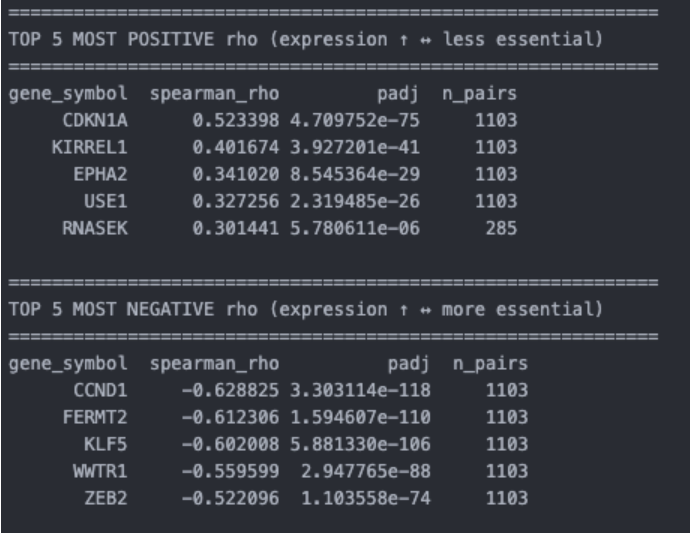
The analysis pipeline itself is correct: the agent computes Spearman correlations between gene expression and the GeneEffect values from DepMap.
The problem arises from the semantics of the GeneEffect column.
In DepMap datasets:
- More negative GeneEffect values indicate stronger gene essentiality
- Less negative (or positive) values indicate weaker dependency
This means the agent actually computed:
corr(expression, GeneEffect)
But the benchmark question asks about correlation with essentiality, which is effectively:
corr(expression, essentiality) = -corr(expression, GeneEffect)
As a result, the magnitude of the correlations is correct, but the sign interpretation is flipped.
The agent assumed that larger GeneEffect values correspond to higher essentiality, which reverses the biological interpretation of the correlation direction. Under that assumption, CCND1 appears as the strongest negative correlation, while the benchmark expects CDKN1A. The same sign inversion also propagates to the threshold-based count in the first question: when evaluating correlations ≥ 0.6, the flipped interpretation causes the agent to report zero genes even though the correct answer is three.
Importantly, this is not a methodological failure. The statistical pipeline is valid, and the computed correlations are numerically correct. The issue stems from a missing semantic assumption about how GeneEffect values map to biological essentiality.
Takeaway
This example illustrates a broader challenge for evaluating biological agents.
Even when the computational workflow is correct, implicit dataset semantics can determine whether an answer is graded as correct or incorrect. Two potential solutions emerge:
- Benchmarks should explicitly document dataset semantics, or the dataset description, confirming the dataset origin
- Agents should learn to verify dataset assumptions, for example by checking documentation or validating whether column interpretations match expected biological behavior.
Both directions will likely be necessary as biological agents move from controlled benchmarks to real-world scientific environments.
Building Toward Better Biological Agents
As biological agents mature, evaluation methods will need to keep pace, so we can better diagnose failures, build reproducible pipelines and advance how agents interact in real-world research settings. We look forward to contributing to more open-source efforts to improve visibility into biological agent performance.
- Learn more about BIOS at ai.bio.xyz or try it here: chat.bio.xyz
- BixBench 50 results: https://bio-xyz.github.io/bio-benchmark/
- See the BIOS docs / GitHub